
CASE STUDY
SURVEY & ANALYTICS PLATFORM

Transforming a Legacy Survey Platform
into a Modern SaaS
Duration
14 weeks

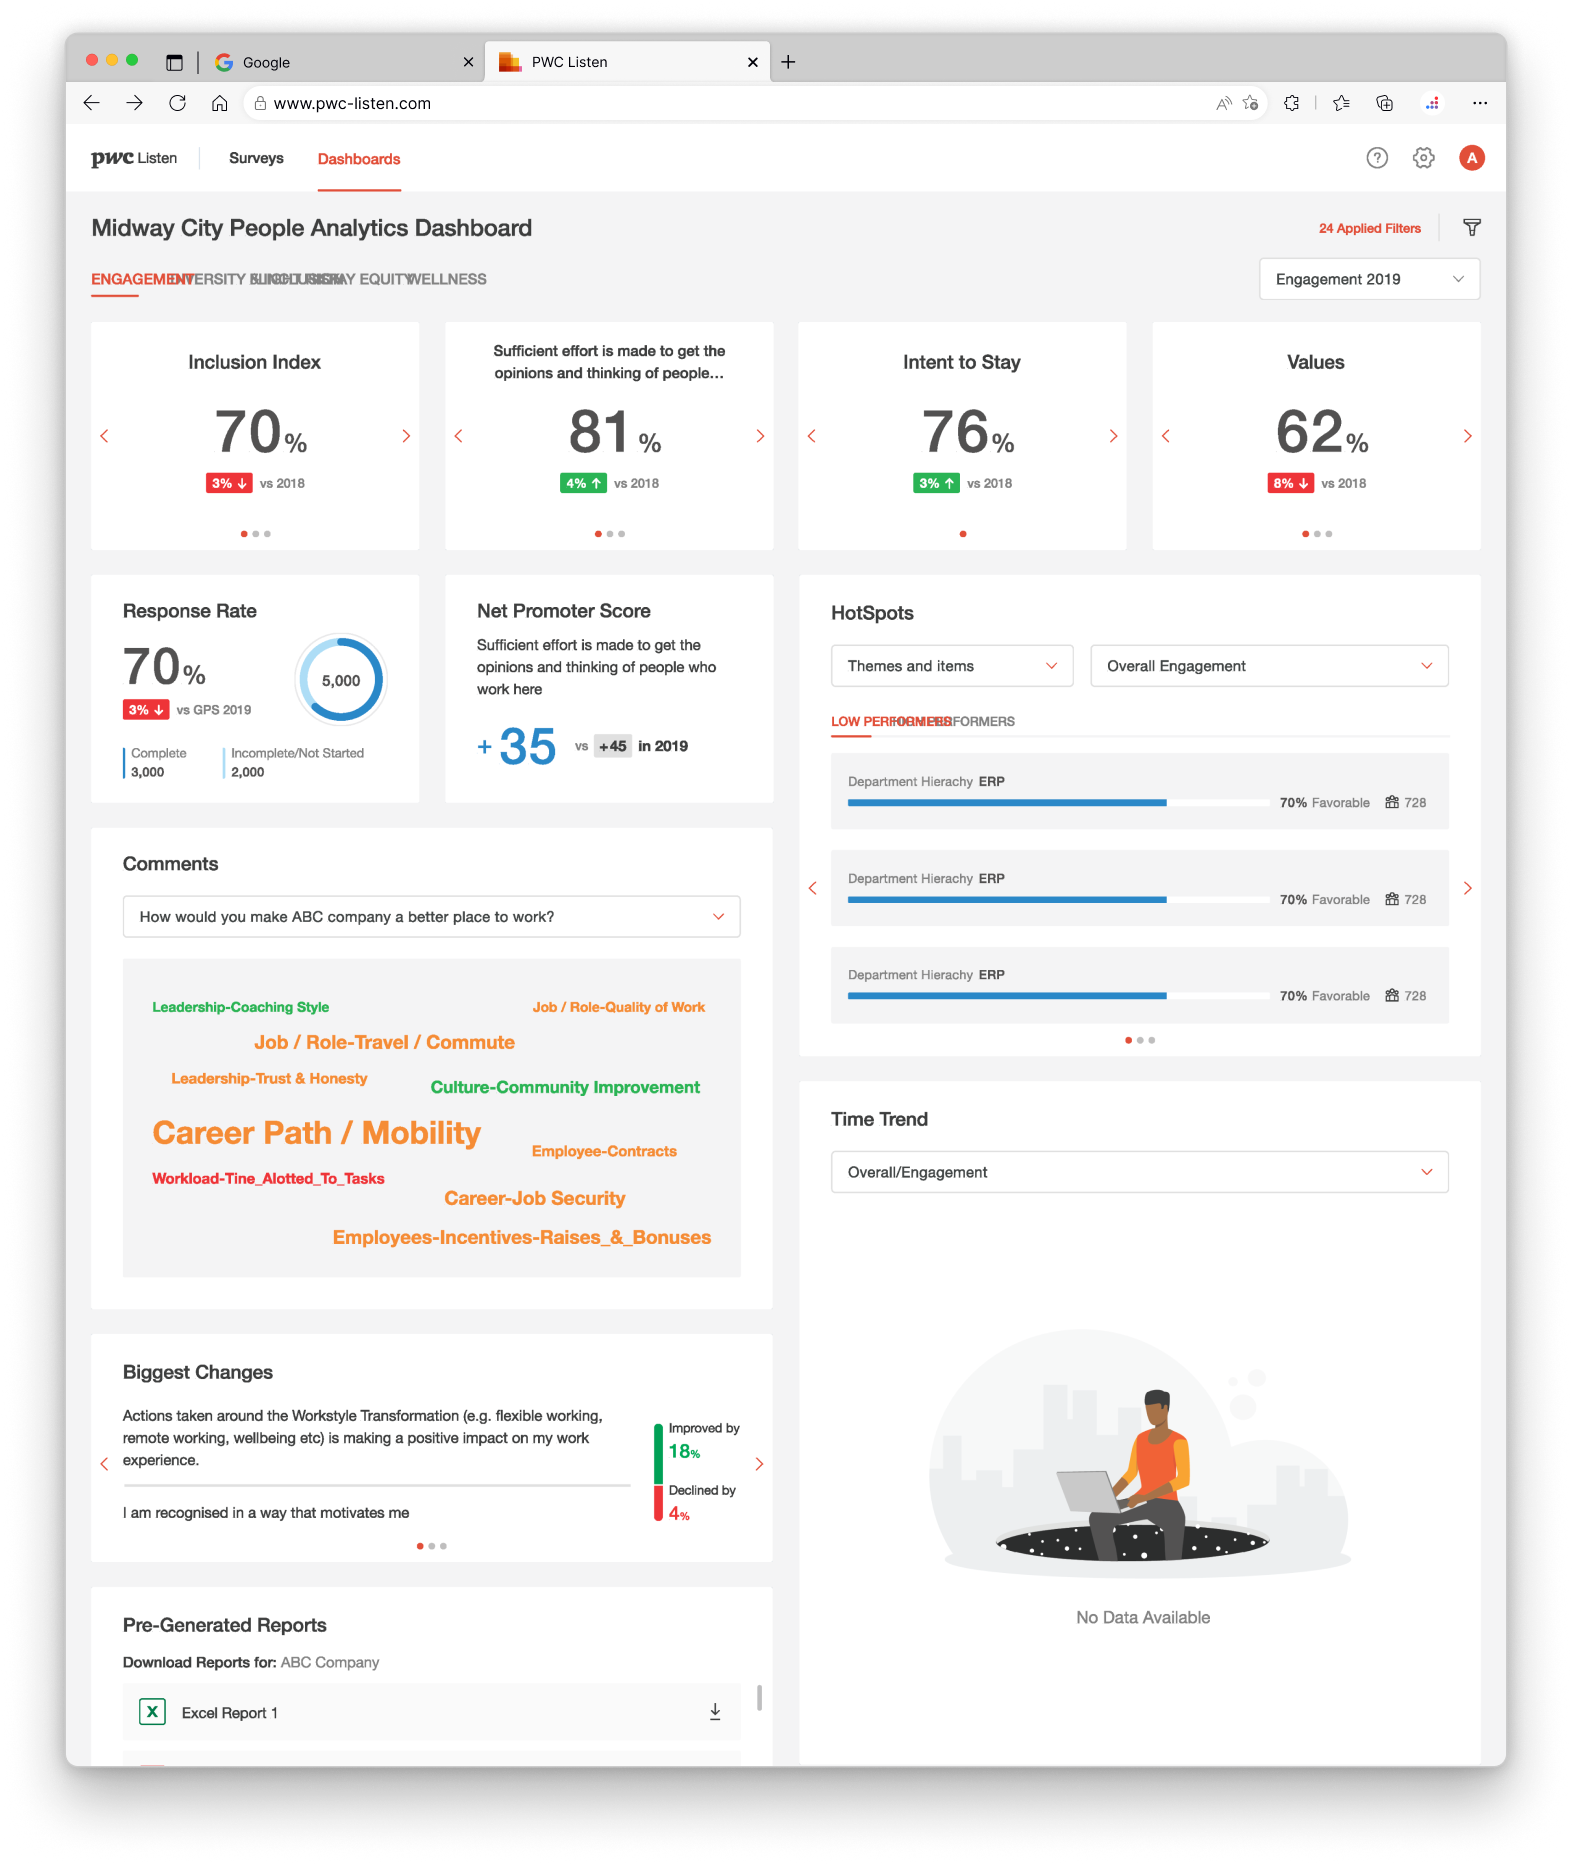
PwC Listen is a survey and analytics SaaS application created by the professional services firm Price Waterhouse Cooper (PwC) that focuses on improving diversity, equity, and inclusion (DEI) within the company and the broader business community.
It was a 10-year-old application that needed to be redesigned to be competitive with platforms like Qualtrics and Medallia.
Team Size
4
Roles
Product Design Lead, User Researcher, Product Designer
PROJECT SUMMARY
Type
1 → N
Tools
Figma, Miro
increase in
CSAT
RESULTS
55%
47%
increase in key
task success
PROJECT PROCESS DESIGN THINKING
38%
increase in
session length from
non-PWC users
We used the Diverge/Converge process, also called the double diamond.
With a super aggressive deadline, so we had to condescend the process. Even with limited research time, we were able to conduct a few user interviews. We made up for that during the testing phase, with a lot of user validation with employees and clients.
1.2 Create Hypotheses
User Experience
Simpler navigation = 40% better completion
Modern UI = 50% higher satisfaction
DEI Impact
Better insights = 35% more engagement
Faster setup = 40% time saved
Platform
New system = 60% faster loading
Modern features = 35% more market share

01
Discover: Research
and gather insights
1.1 User Research & Interviews
1.3. Market Analysis & Trends
Market analysis revealed significant shifts in the enterprise DEI platform space. Leading competitors like Qualtrics and Medallia had already modernized their survey platforms with advanced analytics, real-time reporting, and intuitive interfaces. Key trends included increased demand for specialized DEI features, mobile-first solutions, and actionable insights that could help organizations not just gather data, but effectively track and improve their diversity initiatives.
This analysis highlighted PWC Listen's critical need to evolve from a basic survey tool into a comprehensive analytics platform that could compete in the modern market.


1.4 Stakeholder Mapping
For the PWC Listen project, stakeholder mapping revealed several key groups with distinct needs and influences:
Primary Stakeholders:
PWC Consultants: Daily users needing efficient tools for client DEI assessments
Corporate Clients: External users requiring clear insights and actionable data
DEI Program Managers: Internal champions relying on data for program effectiveness
The mapping helped prioritize competing needs between internal users (PWC consultants/corporate clients) who needed robust analysis tools and external clients who required simplified data visualization and reporting capabilities. This understanding was crucial for balancing feature development and user experience improvements.
1.5 Competitive Analysis
Based on industry trends and market analysis, enterprise analytics platforms were evolving rapidly to meet growing organizational needs. Our competitive analysis revealed that competitors like Qualtrics and Medallia had already modernized their survey platforms with enhanced data visualization capabilities and streamlined user experiences.
These platforms were setting new standards for enterprise survey tools by incorporating advanced analytics, real-time reporting, and intuitive interfaces. The market was also showing increased demand for specialized DEI features that could help organizations track, measure, and improve their diversity and inclusion initiatives. This shift highlighted the critical need for PWC Listen to transform from a basic survey tool into a comprehensive DEI platform that could not only gather data but also provide actionable insights and measure the effectiveness of DEI programs.


02
Define: Focus on specific problem areas
2.1 Synthesize Findings & Insights
Synthesis identified critical gaps in platform performance, user needs for faster survey tools and DEI metrics, and market opportunities in mobile and reporting features. These insights drove our focus on transforming PWC Listen into a modern DEI platform with quick insights and simplified workflows.
2.2 Create User Personas
Our persona development started with data collection from interviews and platform analytics. We identified behavior patterns to create user archetypes, each with specific goals and pain points. After stakeholder validation, these personas guided our design decisions throughout the redesign process.
2.3 Define Problem Statements
Based on our research findings, we identified three core problems: PWC Listen's outdated interface and complex workflows were causing a 40% drop in user engagement compared to competitors; the limited DEI analytics capabilities were preventing organizations from effectively tracking and measuring their diversity initiatives; and the platform's poor performance and lack of mobile optimization was forcing consultants to rely on alternative tools for client presentations. These problems were directly impacting PWC's market position and client satisfaction in the DEI consultation space.
2.4 Set Project Objectives
The PWC Listen project focused on four key objectives: Modernizing the legacy platform to match competitor capabilities and reduce task completion time by 40%; enhancing user experience through improved CSAT scores and simplified data visualization; meeting business goals by increasing market competitiveness and client retention; and strengthening DEI impact through better metrics tracking and streamlined insight generation. These measurable objectives aligned with stakeholder needs and guided our transformation from a basic survey tool to a comprehensive DEI platform.


03
Develop: Create
potential solutions
3.1 Ideate & Brainstorm Solutions
This phase combined collaborative workshops, with stakeholders and users, and stakeholder input to explore solutions across four areas:
User Experience (simplified survey creation, dashboard customization)
DEI features (automated metrics, trend analysis)
Platform Capabilities (cloud architecture, API integrations)
Performance Improvements (optimized loading, cached reporting). Solutions were prioritized based on feasibility and impact.
3.2 Create Concepts & Sketches
During the concept phase, we created rapid sketches and wireframes, exploring key user journeys for survey creation, reporting, and data visualization. Through design sprints, we developed multiple concepts for dashboard layouts, data visualization, and mobile interactions. The most promising ideas that aligned with our user needs were selected for wireframe development.


3.3 Build Prototypes & Wireframes

The prototyping for the project progressed in three stages:
Low-fidelity wireframes establishing core flows and layouts, mid-fidelity mockups refining interactions and data visualizations
High-fidelity prototypes delivering the final UI with utilizing PWCs design system.
3.4 Design Multiple Variations
We developed multiple design variations across key areas of PWC Listen. Dashboard layouts ranged from data-heavy analytics to simplified executive views, while survey creation explored both wizard-based and template approaches. We tested various data visualization styles, with each variation prototyped in Figma and evaluated against core metrics of efficiency, clarity, and accessibility.


04
Deliver: Select and implement final solution
4.1 Test & Validate Solutions
We analyzed the consumer banking industry to better understand the needs of affluent banking customers. In this competitive analysis, we examined competitors' mobile experiences. This approach helped inform our understanding of the affluent banking market landscape before conducting their primary user research with actual customers.
4.2 Refine Final Designs
We analyzed the consumer banking industry to better understand the needs of affluent banking customers. In this competitive analysis, we examined competitors' mobile experiences. This approach helped inform our understanding of the affluent banking market landscape before conducting their primary user research with actual customers.


4.3 Create Documentation
Design Documentation covered comprehensive design and technical specifications. The design system detailed UI components, patterns, typography, colors, and interaction guidelines, ensuring consistency across the platform.
User flows were thoroughly documented with step-by-step guides for key processes like survey creation, report generation, and dashboard customization. Implementation guidelines provided development teams with clear priorities, quality requirements, testing protocols, and accessibility standards to maintain consistency throughout development.
Each section included detailed examples and notes to ensure smooth implementation and maintenance of the platform's new features and design system.
4.4 Launch & Measure Results
The launch of the redesigned PWC Listen platform delivered significant measurable improvements across key metrics:
Performance Results:
55% increase in CSAT scores
47% improvement in key task completion
38% increase in session length from-non PWC users
Core improvements stemmed from the modernized interface, streamlined workflows, and enhanced DEI analytics capabilities. The platform successfully transformed from a basic survey tool into a comprehensive DEI solution that effectively competed with Qualtrics and Medallia.
Post-launch monitoring showed strong user adoption of new features, particularly the improved data visualization tools and mobile accessibility. User feedback validated our design decisions and provided insights for future enhancements.
ContactMe
bbulman@gmail.com
(847) 951-5938