
CASE STUDY
FINANCIAL ANALYTICS APPLICATIONS

Transforming Investment Decisions: Northern Trust's Smart Data Platform

Duration
14 weeks
Team Size
6
Roles
Product Design Lead, Product Designer
Type
1 → N
Tools
Figma, Miro
To remain competitive in the fast-evolving investment outsourcing industry, Northern Trust was committed to providing its clients with the advanced customer experience they desired.
To surpass expectations and achieve this objective, they collaborated with our team due to our proficiency in crafting a customized analytic dashboard that caters specifically to user requirements and business goals.
PROJECT SUMMARY
PROJECT PROCESSDESIGN THINKING
01
Discover: Research
and gather insights
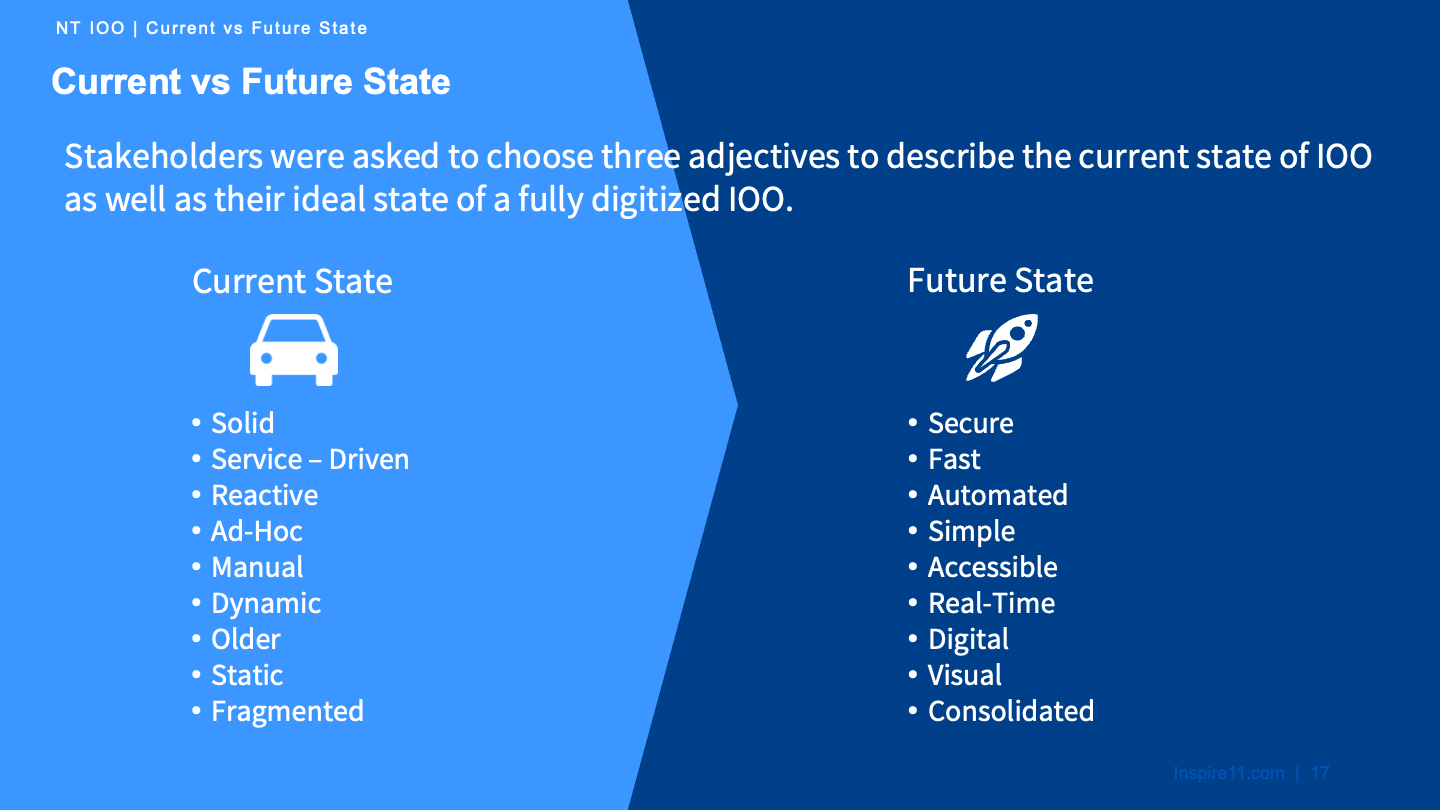
The transformation journey of Northern Trust’s Investment Outsourcing Operations began with user research, for which we conducted 11 interviews with Northern Trust employees across North America and EMEA, as well as 6 external customers. Initial findings revealed that IOO's current state was characterized as "reactive," "ad-hoc," and "manual," with users reporting significant challenges in data accessibility and system integration.
1.2 Identify User Needs & Market Analysis
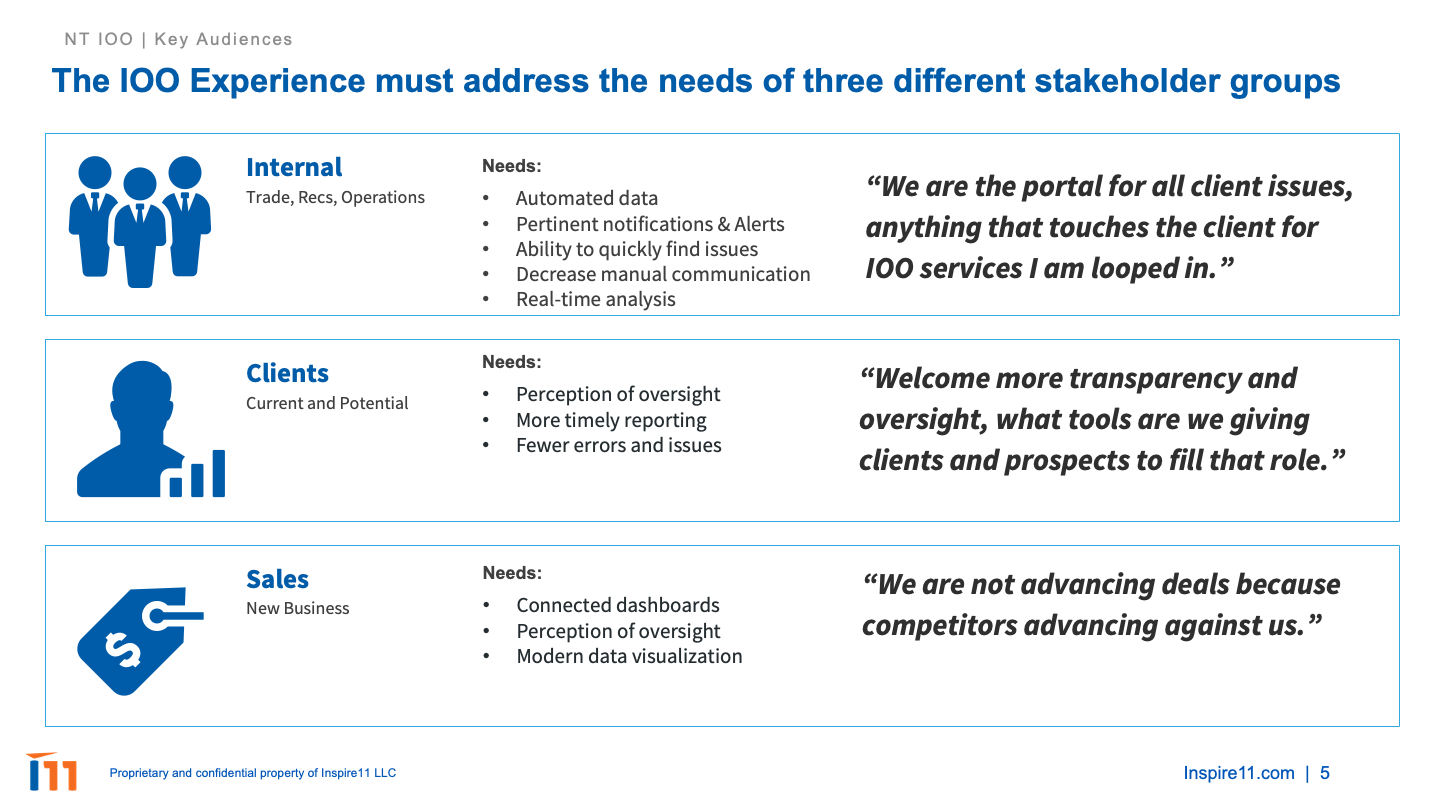
IThrough careful analysis, three distinct user groups emerged, each with specific needs.
Internal teams required automated data and quick issue identification, while sales teams needed connected dashboards and modern visualization tools.
Clients demanded better oversight and more timely reporting.
Market analysis revealed that Northern Trust was losing deals to competitors like SEI and STP, who offered advanced technological workflow dashboards, indicating a clear market demand for higher transparency and greater insight via sophisticated monitoring tools.
1.1 Conduct User Research & Gather Insights
1.3 User Interviews, Observations & Data Collection
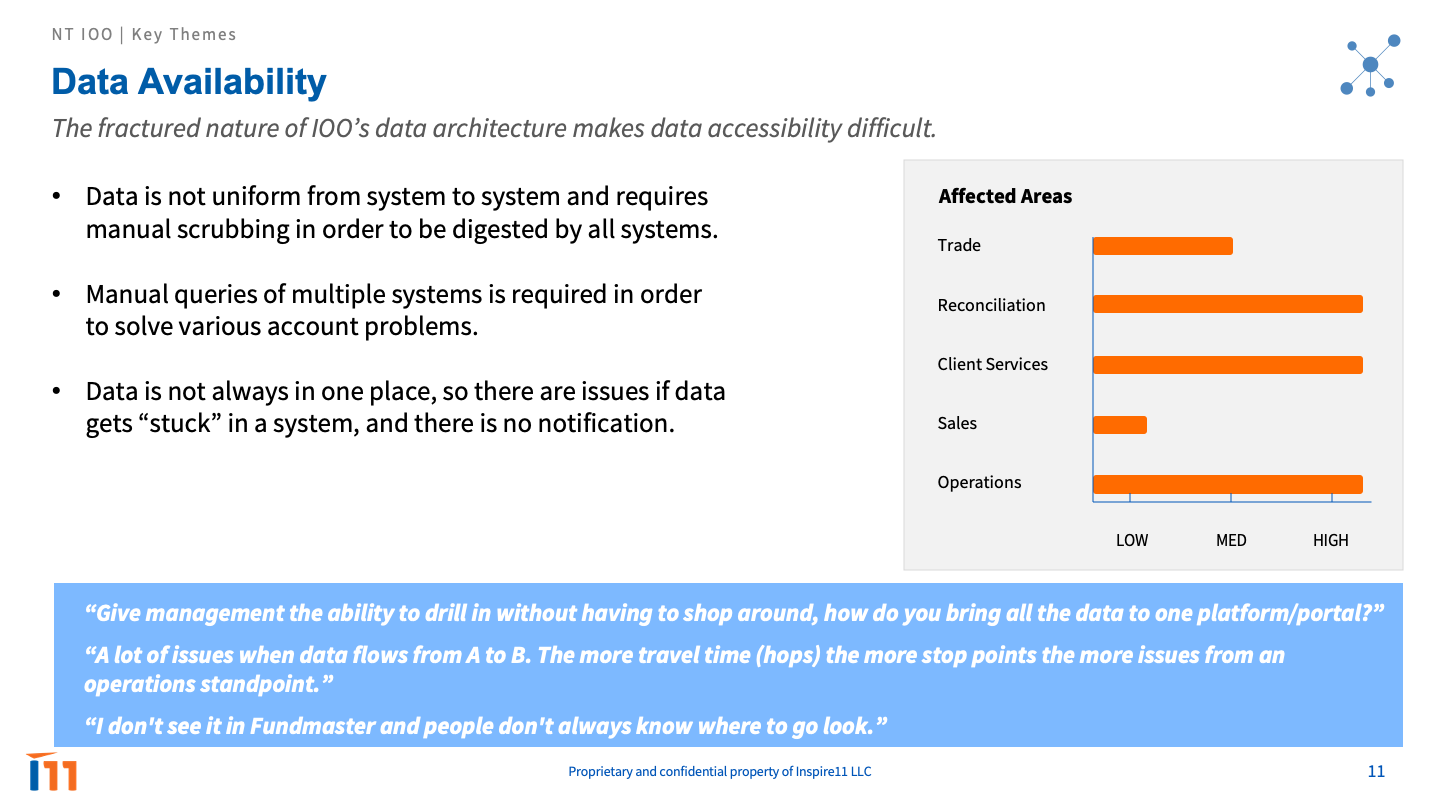
Detailed interviews and observations uncovered that internal users were struggling with fractured data architecture, requiring manual queries across multiple systems.
Client Service Managers reported being unable to be proactive with client concerns due to limited data access.
The team collected comprehensive data on system usage patterns, trade processing workflows, reconciliation processes, and client reporting requirements, building a complete picture of current operations.


1.4 Stakeholder Mapping & Research Synthesis
We mapped key stakeholders across multiple departments, including Operations Excellence, Equity Trade, Client Services, Sales, and IOO Product Leadership.
This mapping exercise revealed five critical themes:
• Data availability challenges
• Perceived lack of oversight
• High cost of manual processing
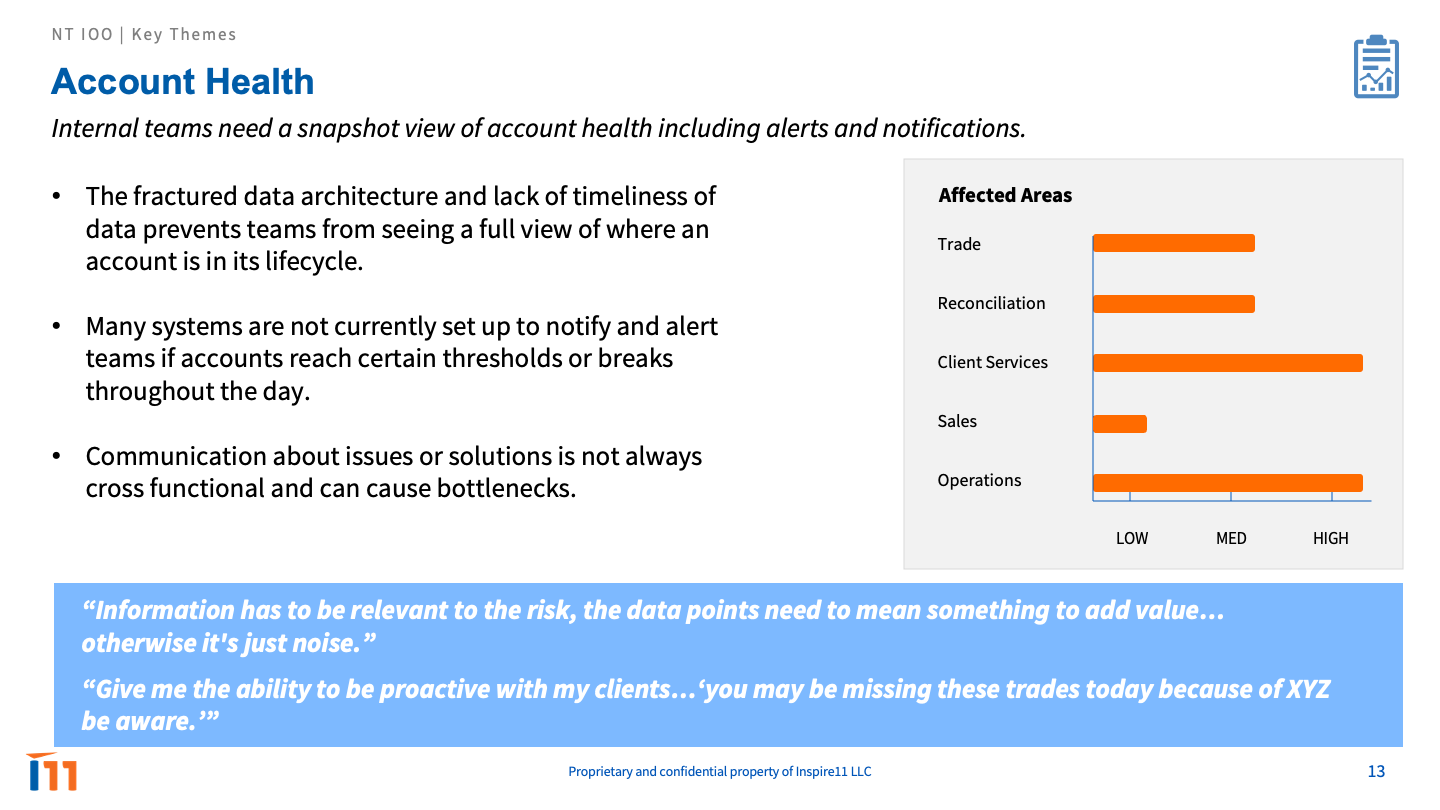
• Limited account health visibility
• Speed and timeliness issues.
These themes would become central to the transformation effort.


02
Define: Focus on specific problem areas
2.1 Analyze Findings & Define Core Problems
Analysis of the research findings revealed that data lacked uniformity across systems, requiring extensive manual scrubbing for processing. Core problems were identified around fractured data architecture, manual processing requirements, limited real-time visibility, and inefficient reporting processes. Users were spending excessive time querying multiple systems to solve basic account problems.
2.2 Create Problem Statements & Set Project Scope
The team developed two primary problem statements:
Investment teams needed a unified data platform to streamline decision-making processes
Clients required a more intuitive digital experience to drive adoption and engagement.
The project scope was carefully defined to encompass trade dashboard development, account health monitoring, reconciliation standardization, and data integration architecture.
2.3 Identify Opportunities & Establish Design Criteria
Key opportunities were prioritized using an impact/effort matrix:
• Trade processing (7/5)
• Reconciliation (9/9)
• Account health (7/7)
• Cash management (5/9)
Design criteria were established focusing on real-time data access, system integration capabilities, user interface customization, and reporting flexibility. These criteria would guide all subsequent development decisions.
2.4 Prioritize Needs & Create User Personas
The team prioritized needs based on both impact and feasibility, with the trade dashboard featuring real-time updates taking the highest priority, followed by account health monitoring and standardized reconciliation dashboards.
User personas were developed for trade operations specialists, reconciliation teams, client service managers, and external clients, ensuring all user perspectives were represented in the solution design.
03
Develop: Create
potential solutions
3.1 Analyze Findings & Define Core Problems
Analysis of the research findings revealed that data lacked uniformity across systems, requiring extensive manual scrubbing for processing. Core problems were identified around fractured data architecture, manual processing requirements, limited real-time visibility, and inefficient reporting processes. Users were spending excessive time querying multiple systems to solve basic account problems.

3.3 Build Wireframes
The team took a systematic approach to wireframe development, starting with three key user scenarios: account dashboards, trade monitoring, and reconciliation tracking. The account dashboard wireframes were designed to provide a comprehensive top-level view of critical metrics for assessing overall account health. Users could customize visualizations and available fields in the widgets, with the ability to save and access custom views for future use. The design allowed for both aggregated client data viewing and detailed account-level drill-downs, ensuring flexibility for different user needs.
For the trade dashboard wireframes, the team created a progress tracker to measure transaction completeness based on trade lifecycle position. Transaction information was bundled into customizable widgets that enabled users to track progress and highlight potential issues. The design included sophisticated alert configurations at both global and client levels, providing timely notifications of pertinent issues.

The reconciliation dashboard wireframes featured a snapshot view of pending issues, with widgets displaying breaks, exceptions, and custodian-related concerns at both global and client levels. Each wireframe incorporated the ability to respond to issues directly within TLM and other systems, streamlining the user workflow and reducing the need to switch between multiple platforms.


3.2 Design Workshops & Collaborative Ideation
Cross-functional workshops brought together technical and business stakeholders to focus on user interface design, data visualization, and system integration. These collaborative sessions resulted in refined technical architecture plans, user experience designs, and implementation strategies that would form the foundation of the final solution.
04
Deliver: Select and implement final solution
4.1 Design Solutions & Test and Iterate
Design mockups were designed for three key components: a trading dashboard, an account health monitoring interface, and a reconciliation tracking system. These designs were then turned into prototypes and underwent usability testing with internal operations teams, client service managers, and technical stakeholders, leading to multiple iterations and refinements.


4.2 Refine Designs & Implementation Planning
Based on testing feedback, the team refined the designs, focusing on user interface improvements, performance optimization, and data accuracy. Implementation was structured around a 10-12 week timeline, carefully breaking down the work into phases: backlog definition (weeks 1-2), data architecture (weeks 3-4), solution development (weeks 5-8), and front-end implementation (weeks 9-12).
4.3 Handover to Development & Success Metrics Definition
The technical handover included detailed specifications, architecture documentation, and integration requirements. Success metrics were established to track system performance, user adoption, processing efficiency, and client satisfaction, providing clear benchmarks for measuring the transformation's impact.
ContactMe
bbulman@gmail.com
(847) 951-8938